Total sales are up
That can look excellent until you discover the growth came from categories that were not a priority or from increasingly risky receivables.
Metrify connects targets, salespeople, categories, branches, collections and receivables so a KPI tells you where to look and what is changing, not only how much you accumulated.
Business metrics become useful when two numbers that look fine on their own reveal a decision once you read them together.
That can look excellent until you discover the growth came from categories that were not a priority or from increasingly risky receivables.
The percentage says little if you do not know which products count, who sold them and which rule turns that result into a bonus.
Two branches can carry the same balance and very different risk if one concentrates debt in the 60+ day band.
Twenty charts do not help if the manager still has to open five reports to decide where to act first.
KPIs that know the rules
In Metrify, an indicator can drill down to item, line, group, salesperson, branch, period and target before deciding what should count and how to read the result.
Total sales, categories, target attainment and bonuses under specific rules.
Collections, overdue receivables, aging and recovery next to commercial performance.
The same branch can show
120% · Sales
Above the commercial target.
82% · Collections
Recovery below expectations.
↑ · Overdue
More balance past due.
↑ · 60+ days
Risk concentrating in older debt.
Real dashboard
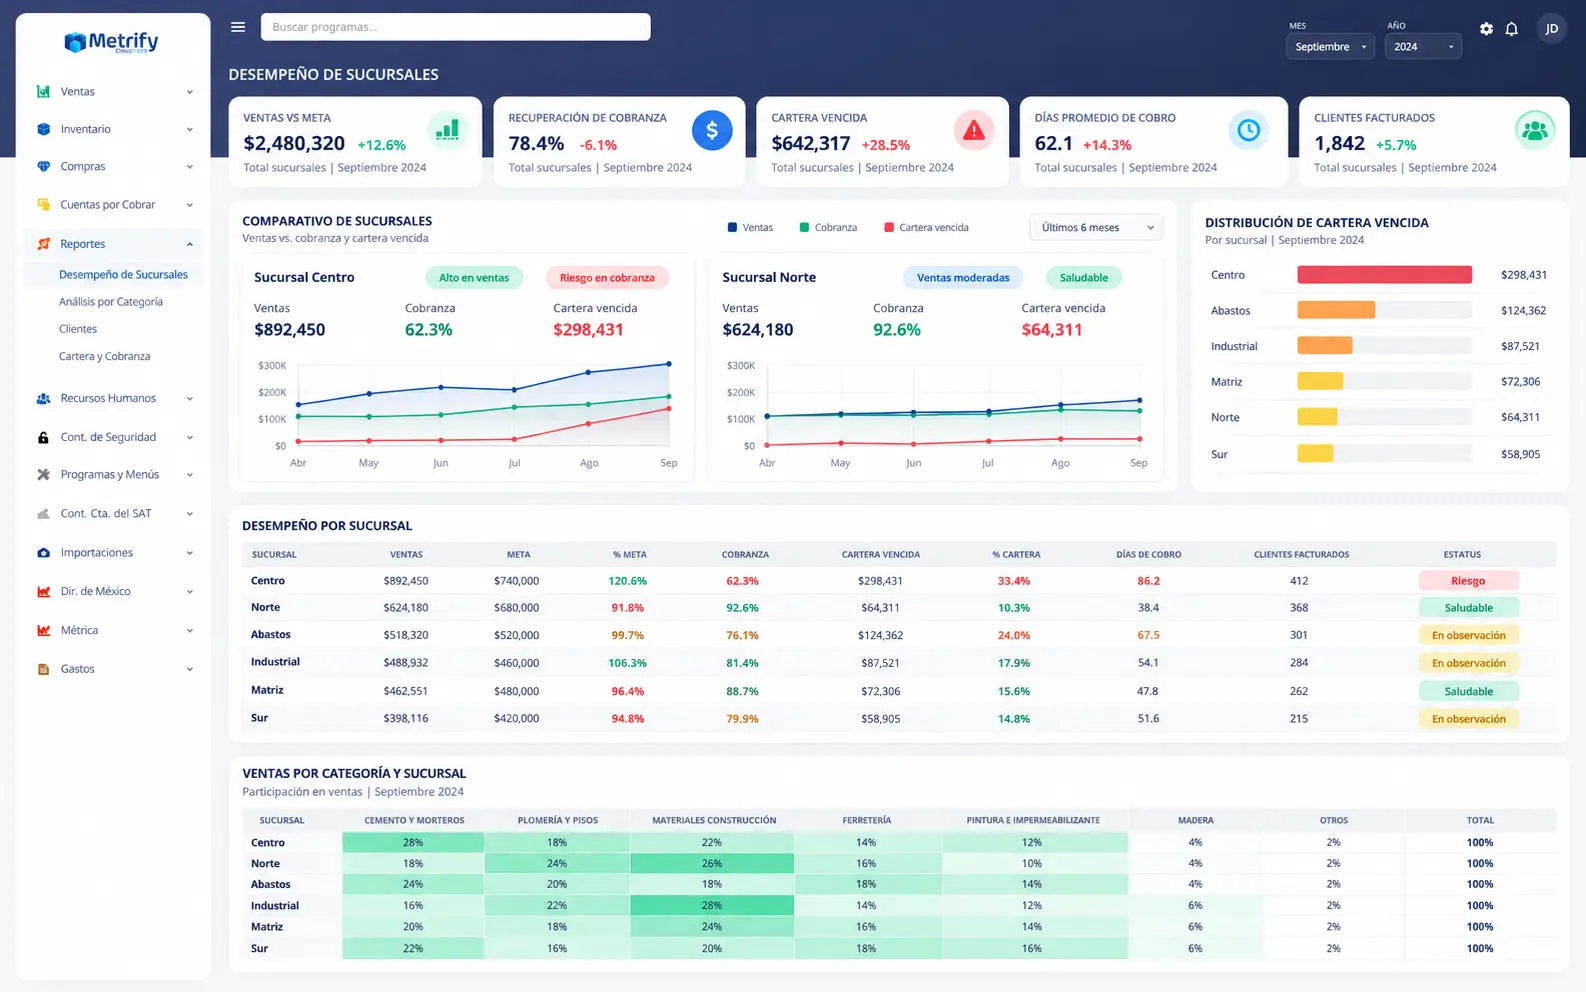
The heatmap compares salespeople and branches by commercial groups, targets and results without opening each location one by one.
Metrics for companies
Metrify separates commercial indicators, credit, receivables and management views because each one answers a different question.
Selling $850,000 does not tell the whole story.
A salesperson can end the period at 108% of their total target, 94% in Plumbing & Flooring and 127% in Paint & Waterproofing. Metrify does not calculate that from total sales alone: it identifies the item, its line, the group it belongs to and the indicator in which it should participate.
That makes it possible to measure how much of the result came from the families the company actually wants to push and to compare people even when their targets are different.
Reaching 100% may only be the beginning.
Target attainment normalizes results against the assigned target. If the compensation rule says the base bonus begins at 100% and keeps growing proportionally above it, the dashboard can translate performance using the same logic the company uses to pay.
The value is not another progress bar. It is keeping the real interpretation of the indicator from living in a separate spreadsheet outside the ERP.
A branch can sell a lot and get worse at the same time.
Credit receivables, overdue receivables, aging and collections show what happened after the sale. The same outstanding amount can represent very different situations depending on whether it is due tomorrow or has been unpaid for more than 60 days.
By comparing those indicators with sales, management can avoid easy conclusions: a branch with high sales is not necessarily healthier if its overdue receivables are also growing.
Priority can become a visual reading too.
With many branches, opening one report per location forces the manager to make the comparison mentally. A heatmap can reveal patterns: low sales with high overdue receivables, weak categories, lagging attainment, or a commercially strong operation with healthy collections.
The goal is to reduce the time between detecting an anomaly and opening the detail that explains it.
Why Metrify is called Metrify
Metrics did not arrive as a separate module. They grew on top of sales, items, lines, groups, branches, salespeople, targets, credit and collections already present in the operation.
That context makes it possible to build indicators that are less generic and closer to the questions managers actually use to run the company.
Commercial progress against a defined target.
Indicators that count only the corresponding lines and groups.
Receivables, aging and recovery.
Comparative view for finding where to act first.
From the indicator to the operation
Explore the operational areas feeding Metrify KPIs.
Learn to read the business
Sales, targets, receivables and branches through concrete examples.
What Metrify can measure and what it means for an indicator to understand the operation.
Metrify can show commercial indicators such as total sales, categories, target attainment and bonuses, plus credit metrics such as receivables, overdue balances, aging and collections. Exact availability depends on each company's configuration.
Yes. Indicators can be analyzed by people, branches, categories, groups and periods when those dimensions are part of the business rule.
Yes. Metrify can compare results against assigned targets and express progress as a percentage for easier comparison.
It is a view that compares indicators across locations and visually highlights strong results, lagging areas or signals that deserve attention.
Metrify is not positioned as a universal ad-hoc BI platform. Its current strength is turning real ERP operating rules into dashboards and indicators ready to manage the business.
Bring the spreadsheet, exception or process that still depends on calls, memory or repeated data entry. Start there.